Image

Housing Recovery Continues

Dec. 31, 2014
According to NAHB analysis of data from the Census Bureau and HUD, the pace of total November housing starts was down slightly (1.6%) from an upwardly revised October number.

Data for housing construction activity in November indicate the recovery continues as builder confidence remains positive.

According to NAHB analysis of data from the Census Bureau and HUD, the pace of total November housing starts was down slightly (1.6%) from an upwardly revised October number. The October housing starts estimate was revised up from the initial reading of 1.009 million units (on a seasonally adjusted annual pace) to 1.045 million, with increases for both single-family and multifamily construction.

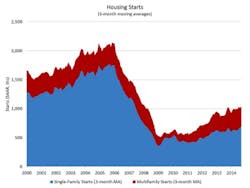
On a three-month moving average basis, total housing starts recorded a post-recession high and have now been above a one million annual rate for three consecutive months.

The rate of single-family construction starts came in at 677,000 in November, down 5.4% from the elevated October reading (716,000). On a three-month moving average basis, the single-family starts rate stands at 685,000, which is also a post-recession high. Multifamily starts of properties with five or more units increased 7.6% to a 340,000 rate in November. The starts rate for 5+ unit construction has been in an approximate stable range of 300,000 to 350,000 since August.

The November starts data was consistent with the most recent reading of builder confidence. Following a four-point uptick last month, builder confidence fell one point in December to a level of 57, according to the NAHB/Wells Fargo Housing Market Index.

After a sluggish start to 2014, the HMI has stabilized in the mid-to-high 50s for the past six months, which is consistent with our assessment that we are in a slow march back to normal. Heading into 2015, the housing market should continue to recover at a steady, gradual pace. Home builders in many markets across the country have seen their businesses improve over the course of the year, and we expect builders to remain confident in 2015.

After months of uncertainty, Congress adopted legislation that would extend a number of housing policies that expired at the end of 2013, although only for 2014. While this offers help for the coming tax filing season, Congress will once again need to deal with a set of expiring tax rules during the 2015 session.

These provisions include extensions of the 45L $2,000 energy-efficient home credit, the 25C energy-efficient remodeling credit, the deduction mortgage insurance (including PMI and FHA premiums), the 9% fixed rate for the Low-Income Housing Tax Credit, and the mortgage forgiveness tax exclusion. Builders, remodelers and their clients are well advised to research whether these extended provisions can provide a tax benefit for qualified activities in 2014.

With respect to monetary policy, the Federal Reserve's Federal Open Market Committee concluded its December meeting. The Fed is confident that the economy is improving and cumulative gains in economic conditions most likely warrant increasing the funds rate sometime in 2015. A mid-year increase seems to be a consensus forecast at this point.

Consumer and producer price data for November show positive impacts due to declining energy prices. The consumer price index was pushed down in November by falling gas prices.  However, inflation-adjusted residential rents have increased 1.7% over the last 12 months.

For producers, overall prices declined by 0.2% in November. Softwood lumber prices declined 2.1% for the month but have mostly moved sideways in 2014. OSB prices ticked up 0.7% in November but are down 9.9% from year ago levels. Gypsum prices inched up 0.3% in November and have increased 11.1% over the last 12 months, with 2015 increases expected.

In analysis news, recent data from the Federal Reserve's Flow of Funds indicates that price gains for housing have boosted household net worth. During the third quarter, the market value of real estate held by U.S. households increased by $180 billion.  Household equity in real estate increased 1.6% for the quarter. Lastly, NAHB economists used American Housing Survey data to examine homeowners' disaster preparedness.

Voice your opinion!

To join the conversation, and become an exclusive member of EC&M, create an account today!

Sponsored Recommendations

Latest from Business Management

ID 335485132 © Imaginiac . | Dreamstime.com
The Top 5 Electrical and Construction Industry Trends for 2025
In the typical facility, the plant manager has X amount of discretionary spending power that can be directed toward a single purchase. At each level of management down, discretionary spending is stepped down into smaller amounts. Anything beyond a given manager’s limit must be appealed to the next level up. For example, the Plant Engineer can’t quite swing a purchase of $5200 but the Plant Manager can approve it. This informal arrangement reduces corporate overhead and improves operational efficiency. It does not address whether the spending decisions would make financial sense to the Chief Financial Officer, but the cap at each level keeps any mistakes to a reasonably acceptable loss or misallocation of resources. Beyond the Plant Manager’s limit, there is usually a formal process for getting spending approval. It typically involves filling out a Capital Request (or similarly named form). In well-run companies, the form is very structured. It mostly wants some basic information that will give the reviewer(s) the ability to justify not just the purchase but also the cost of acquiring the capital to do so. Because the funds will typically be borrowed by the corporation, the cost of capital must be balanced against the return on investment. There will be at least one person crunching the numbers to make what is called “the business case” for the proposed spending. Making the business case is something you should do, in some way or another, when considering spending within your approved limits. If the spending is above your approved limits, then the manager above you will need a bit beefier of a business case. The business case must take into account the value obtained versus the money spent. Consider the purchase of a thermographic camera. If you intend to purchase a mid-range camera but nobody at your facility is trained and certified in its use, the purchase is probably a waste of money. You’d be better off getting an entry-level camera and then arranging for a path toward certification if you intend to have that ability in-house and it makes operational and financial sense to do so. And generally, it makes sense to have a person or two with Level I certification so they really understand how to get the most out of a camera system that’s beyond the basic level. On the other hand, if you were a manager at an electrical testing firm with several Level III Thermographers you would be wasting your thermographers if you decided to “save money” by equipping them with only basic or even intermediate camera systems. Your firm needs to be able to troubleshoot problems when that important client calls in a panic. Your thermographers need the tools to do that job, and “cost-saving” on camera systems won’t cut it. Presumably, your clients are smart enough to already have basic camera systems; they just don’t have the expertise to use advanced systems. Sometimes a different logic applies to other types of test equipment. In the typical plant, maintenance electricians need sophisticated DMMs. If they lack the training to use the features that are needed for most effectively keeping equipment running, simply choosing a less capable DMM they already know how to use is not the answer. They need the appropriate DMM along with the training on how to use those features correctly. So far, we haven’t looked at the need to crunch any numbers to make the business case. What we have done is think about the match between the purchase, the problem that needs to be solved, and the ability of the user to solve the problem using that purchase. This sounds like a common sense approach that everyone would naturally take, but people often lose sight of the reason for the purchase in the first place. The tendency is to either go all out on something they can’t use or don’t need, or to “save money” by shortchanging the end users with something that doesn’t allow them to do what they need to do. What about those numbers? When you do a purchase request, a bean counter is going to try to determine the cash flows involved (typically in monthly periods). If you write something like, “The payback period is three years,” they don’t find that helpful. Lenders care that a loan can be serviced, and cash flow is the critical factor in calculating whether it can. Thus, beancounters don’t use payback to determine whether they can afford to borrow. They use the Internal Rate of Return (IRR) or Modified Internal Rate of Return (MIRR). Formulas for both IRR and MIRR have been in spreadsheet programs for over two decades, but before that they were determined using a Business Math Calculator (about $150 in 1990). And before that, they were laboriously calculated by hand. The cash flows that are charted will be either additional revenue generated or losses prevented. To help the person who figuratively wears the green eye shade, tie the use of the test equipment to a revenue stream. A major appliance plant in Tennessee has several production lines that collectively produce $1,560,000 per hour of revenue. Thus each minute of unplanned downtime is quite costly. If the plant electrical engineer there wanted to upgrade test equipment in a way that exceeds the Plant Manager’s spending authority, he needs to help the green eye shade guy do the math. He can cite short case histories from the past two years and briefly explain how having X capability (present in the new equipment, absent in the existing equipment) would have saved Y minutes of downtime (which the green eye shade guy will calculate out in terms of revenue and cash flow). The green eye shade guy also needs to know whether each case history is a one-off that will never recur or if it’s representative of what to expect in the future. You can settle this question with a brief explanation. For example, “The responding technician did not have a [name of test equipment]. Consequently, he had to arrive at the same conclusion by other means to the tune of 24 minutes of downtime he would not have incurred if he’d had a [name of test equipment]. This problem occurred once on Line 2 and twice on Line 4.” Now the green eye shade guy can simply add up the downtime, monetize it, and create the cash flow analysis. And it’s really good for something like a power monitor. For example, “In this particular case the plant did not have a monitoring system capable of detecting short-term bursts of power, which we call transient spikes, and alerting us. Transients happen with no notice, and usually without being detected. The motor shop forensic report shows the main motor failed due to winding insulation failure caused by transients. With a power monitor detecting and reporting those transients, we would have been able to intervene before outright failure, on a scheduled basis. That would have reduced downtime by 57 minutes twice last year alone.” Making the business case for your smaller purchases means simply thinking about what you are trying to accomplish and then making sure you are spending the funds correctly to achieve that goal. But as you go up the food chain, you need to make the picture more clear. And when you appeal to corporate for approval, you need to provide reasonably accurate downtime savings numbers that can be converted by them to revenue loss prevention in specific dollar amounts.
Man staring at wall with hand-drawn question marks and money bags on it

Sponsored