The Highs and Lows of Photovoltaic System Calculations

The power electronics components of a photovoltaic (PV) system, such as grid-direct inverters, have maximum and minimum voltage inputs; therefore, you need to adjust the module voltage values to meet your specific needs on each project. This ensures the proper operation of your system. But before jumping into any voltage correction calculations, it’s important to understand the fundamental voltage and current outputs from PV modules and how they vary with changes in temperature and sunlight intensity (irradiance).

PV modules are rated with two different voltage values — open circuit voltage and maximum power voltage. Open circuit voltage occurs whenever there isn’t any load connected to the PV modules, and current is not flowing. Maximum power voltage is the amount of voltage produced by the module that corresponds to the maximum amount of power for that module. The yellow line on Fig. 1 below, a typical current versus voltage curve, shows you that the open circuit voltage (Voc) value occurs at the bottom right side of the curve. At this point, the voltage is at its maximum, and current flow is zero. The maximum power voltage (Vmp) is directly below the knee of the curve shown. Voc is always a greater value than Vmp for PV modules. Module manufacturers will commonly show the power versus voltage on the same graph, as seen with the blue line.
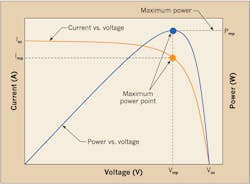
Fig. 1. A typical current verus voltage curve for PV modules shows how each factor relates to the other at a defined temperature and irrdiance level. The module's power versus voltage is also represented on this graph.
If you draw a straight line down from the knee of the IV curve, you intersect with the Vmp value. If you also draw a straight line to the left of the knee, you intersect with the maximum power current value (Imp). The product of those two values (Vmp × Imp) results in the maximum power value in watts. The final point shown on the upper left corner of Fig. 1 is the short circuit current (Isc). That is the scenario where the positive and negative terminals from the PV module are in direct contact. While this situation may not damage the module, current is flowing within the module(s), and care must be taken when interrupting the current flow. Improper disconnection can result in pulling a DC arc that can be difficult to extinguish.
All PV modules will list all five values on their spec sheets and, as a listing requirement, on a label attached to each module. The values reported are always at standard test conditions (STC). For module voltage and current values, the two critical STC values are for temperature [25°C (77°F)] and irradiance [1,000 W/m2].
The temperature value is for the PV module itself, which will be a function of the ambient temperature. You can use some tools noted in this article to estimate module temperature based on ambient temperature values. The irradiance value can be related to a bright sunny day at sea level. Both of these values will vary over the course of a day. Therefore, it’s your job to realize how these changes in environmental conditions affect the voltage and current.
The amount of current produced by a PV module is directly proportional to how bright the sun is. Higher levels of irradiance will cause more electrons to flow off the PV cells to the load attached. The amount of voltage produced by the PV module is affected by the irradiance value, but not as much as most people initially think. In fact, Fig. 2 below shows a graph of a typical module’s IV curve in response to irradiance. The PV module’s voltage changes very little with varying levels of irradiance. Crystalline PV modules will produce approximately 90% of their rated voltage at irradiance levels of approximately 200 W/m2. As the irradiance value continues to increase, so does the voltage — but at a much slower rate. Therefore, for the purposes of this article — and your design methodologies in general — it is safe to assume that if there is ambient light, the PV module has the ability to produce its full rated voltage.
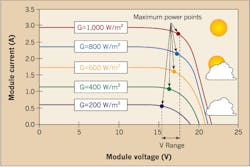
Fig. 2. A PV module's current versus voltage curve varies with the irradiance or intensity of sunlight. As the graph shows, current dramatically changes as irradiance varies, but voltage remains relatively constant.
A PV module’s voltage output is actually a variable value that is primarily affected by temperature. The relationship between module voltage and temperature is actually an inverse one. As the module’s temperature increases, the voltage value decreases and vice versa. You can see this correlation in Fig. 3 below. The variable output voltage is an important factor for both cold temperatures and hot temperatures, and both must be considered during system design. When temperatures are cold, the PV module will increase in voltage. When it is hot, the module’s voltage will drop. Both are simple and unavoidable facts in PV design. So as long as you account for both properly, you won’t have any issues in the performance of your array — at least not due to the voltages.
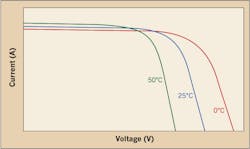
Fig. 3. As temperature changes, a module's current versus voltage curve will also change, primarily in terms of voltage.
PV module manufacturers will report the amount of change their modules experience in the form of temperature coefficients (TCs), most often in terms of a percentage per degree Celsius (e.g., TC Voc = -0.35%/°C). This means that for every degree change in temperature, the module’s Voc will change in the opposite direction by 0.35%. For example, if the PV module got colder by 1°C, the PV voltage would increase by 0.35%. This specific value happens to be common for crystalline PV modules.
There are two additional points to make on TC values. One, there are two TCs for every PV module — one for the Voc and one for the Vmp. The amount of change experienced by each is different and needs to be calculated differently. Secondly, PV module manufacturers rate their modules at 25°C. This means that when applying temperature coefficients, you need to figure out how many degrees Celsius the PV module is operating from the STC value of 25°C.
PV modules will “wake-up” every morning with very little sunlight. Because the PV array is sitting outside, the temperatures of the modules will be the exact same value as the night air. Because the sun isn’t actually hitting the array immediately, the modules will not immediately produce any current, which means they will immediately go to open circuit voltage. If the temperature of the module is less than the STC value of 25°C, the module’s Voc value will actually be greater than the value listed on the module’s listing label. For our discussion, we will consider the temperature of the module to be equal to ambient temperature at daybreak. You will estimate the new module voltage to verify too many PV modules aren’t placed in series and exceed the power electronics maximum input value.
Once the sun comes up a bit and is able to reach the array, there will be enough irradiance to allow current to flow, which will result in the module’s voltage dropping from Voc to a value close to the Vmp point. Where the voltage value lands exactly is a function of the temperature of the PV module. As the day wears on — and the module is exposed to the sun for a longer period of time — the temperature of the module will continue to rise. How hot the PV module finally gets depends on how hot the ambient temperature is and how close the module is to anything that may trap heat, such as a rooftop. So to estimate the temperature of the PV modules in the middle of the afternoon, you can use the following values:
- Less than 6 in. of space between the module and roof surface: Tmod = Ambient + 35°C.
- More than 6 in. of space between the module and roof surface: Tmod = Ambient + 30°C.
- PV array mounted on a top of pole or elevated ground mount: Tmod = Ambient + 25°C.
These are values that are relatively accepted in the PV industry and used by many manufacturers in estimating PV module voltages at various temperatures. This calculation will help verify that enough modules are placed in series to keep the power electronics operating in the middle of the summer.
At this point in our discussion, you may be curious as to what exactly is the right temperature to use in your calculations. The answer is it really comes down to what you are most comfortable with. Some people choose the most conservative route, using both record cold and record high temperatures as the basis of their calculations. This is probably overly conservative but certainly won’t be questioned by many AHJs. The more common practice is to use the values presented by the American Society of Heating, Refrigerating and Air Conditioning Engineers (ASHRAE). This group has published temperature data collected and averaged for different seasons of the year. For PV systems, the two values most designers look for are the lowest expected ambient temperature and the 2% high temperature. The 2% high temperature represents a value that is likely to be exceeded only 14 hours over a summer month. The 2011 NEC references the ASHRAE data in an informational note in 690.7.One excellent resource for this weather data can be found on the Solar America Board for Codes and Standards (Solar ABCs) website: www.solarabcs.org. This group has an interactive map in the “Expedited Permit Process” section of its website that reports these values and more.Are you feeling confused? Well, there’s no better way to help drive home a discussion on electrical design than through an example problem. Let’s say you have a PV module with the following rated voltage values, TCs, and expected temperature values:
- Voc = 44.4
- Vmp = 35.4
- TC Voc = -0.33%/°C
- TC Vmp = -0.45%/°C
- PV array mounted 5 in. from a roof surface in Sacramento, Calif. [minimum expected temperature as reported on solarabcs.org: -3°C; 2% high temperature: 37°C].
The first calculation we need to make is for the adjusted Voc. Section 690.7 of the 2011 NEC lists the requirements for adjusting the module Voc. In short, the Code says that if the module manufacturer provides the temperature coefficient data, then you shall use this data to calculate the adjusted module voltage for cold temperatures. If the manufacturer does not supply the data — and the module you are using is based on a crystalline technology — then you can use Table 690.7 to estimate the module’s adjusted voltage. The NEC will always be more conservative than the actual calculation, so it may prove useful for you to run the actual calculation. If you’re using a technology other than crystalline, then you will have to run the calculations, as the values listed in the Table will not apply.
To calculate the module’s adjusted voltage, you can use the following equation:
Vadj = Voc × {100% + [(Tmod - 25°C) × TC Voc]}
where,
- Vadj is the temperature adjusted voltage
- Voc is the module’s rated open circuit voltage
- Tmod is the temperature of the PV module
- 25°C is the STC condition we must adjust from
- TC Voc = Temperature correction factor in %/°C
Using the values supplied in our example above, you can solve for Vadj as follows:
-
Vadj = 44.4V × {100% + [(-3°C - 25°C) × -.33%/°C]}
= 44.4V × {100% + [(-28°C) × -.33%/°C]}
= 44.4V × {100% + 9.24%}
= 44.4V × {109.24%}
= 48.5V
What this tells us is we really need to apply a Voc value of 48.5V (not 44.4V) when determining how many modules we can place in series on a specific inverter or other pieces of power electronics. The reason this is an NEC issue is because placing too much voltage on equipment could potentially damage it or cause injury to people.
The other calculation we need to make is for the Vmp value at high temperatures. This is not addressed in the NEC, so you will have to use the calculation method to determine the answer (i.e., there isn’t a Table you can reference like there is for cold temperatures). In this calculation, the formula is exactly the same; you just have to apply different values for each of the variables.
The first variable to consider is the temperature of the module. As mentioned earlier, the module’s temperature is a function of the ambient temperature plus the method used to mount the PV array. In this case, the array is placed 5 in. from the roof surface, so we will estimate the PV module temperature to be 35°C above the ambient: Tmod = 37°C +35°C = 72°C
-
Vadj = Vmp × {100% + [(Tmod - 25°C) × TC Vmp]}
where,
Vadj is the temperature adjusted voltage
Vmp is the module’s rated maximum power voltage
Tmod is the temperature of the PV module
25°C is the STC condition we must adjust from
TC Vmp = Temperature correction factor in %/°C
Again, using the values supplied in our example above, you can solve for Vadj as follows:
Vadj = 35.4V × {100% + [(72°C - 25°C) × -.45%/°C]}
= 35.4V × {100% + [(47°C) × -.45%/°C]}
= 35.4V × {100% + -21.15%}
= 35.4V × {78.85%}
= 27.9V
This results in a PV module that will only produce 27.9V in the middle of the summer. Therefore, you need to make sure that you have enough modules wired in series so that the sum of the modules’ adjusted voltages are always above the minimum required by the power electronics while staying below the maximum values during cold temperature periods.
If you’re working with an inverter that can accept up to 500V maximum but needs 200V minimum, you can calculate the acceptable number of modules in a series string as follows:
-
500V ÷ 48.5V = 10.3 modules
Thus, you could place a maximum of 10 modules in series and remain below the maximum in all temperatures expected at your site.
On the low end, 200V ÷ 27.9V = 7.2 modules
Thus, you would need at least eight modules in a series string to remain above the minimum requirement at your site.
As you can see, these calculations are an important part of the PV design process. In fact, many power electronic manufacturers, especially grid-direct inverter manufacturers, supply on-line calculators to help you work through these calculations. However, you shouldn’t totally rely on their calculators, as they are not official parts of their website. Prior to using these calculators you must always click a button acknowledging that the information they present may not be fully accurate. They’re not a bad tool to double check your calculations though.
Mayfield is a principal with Renewable Energy Associates, Corvallis, Ore. He can be reached at [email protected].